配置日志快速输出不成功,请各位大侠帮看看
- 0关注
- 0收藏,393浏览
问题描述:
按照配置指导文档,完成配置后,验证配置发现不成功。
日志服务器是centos7,配置rsyslog服务,udp514,tcp514均打开,内置firewall服务关闭。通过命令netstat -tulpn | grep 514查得端口监听正常,通过网络中的其他电脑用tcping测试,可以正常ping通tcp514端口。通过tcpdump -i any port 514命令可以正常侦测到tcping发送过来的报文
F1000防火墙在配置完成后,通过tcpdump -i any port 514命令发现没有侦测到防火墙发送过来的任何514端口报文
组网及组网描述:
#信息中心默认开启
info-center enable
#
#nat log日志开启
nat log enable
nat log flow-active 30
nat log flow-begin
nat log flow-end
#
#customlog相关配置
customlog format nat telecom
customlog format session
customlog format security-policy sgcc
customlog format dpi ips sgcc policy-hit
customlog format dpi anti-virus
customlog format scd
customlog host 172.17.122.240 export telecom-userlog
customlog host source M-GigabitEthernet1/0/0
#
#接口
interface M-GigabitEthernet1/0/0
ip address 172.17.122.231 255.255.255.0
#接口的安全域
security-zone name Management
import interface M-GigabitEthernet1/0/0
import interface M-GigabitEthernet1/0/1
#
#安全策略
security-policy ip
rule 60 name local-Management
action pass
source-zone Management
destination-zone Local
rule 61 name Management-local
action pass
source-zone Local
destination-zone Management
#
#测试ping日志服务器
[YQLT-H3C-F1000]ping 172.17.122.240
Ping 172.17.122.240 (172.17.122.240): 56 data bytes, press CTRL+C to break
56 bytes from 172.17.122.240: icmp_seq=0 ttl=64 time=0.698 ms
56 bytes from 172.17.122.240: icmp_seq=1 ttl=64 time=0.604 ms
56 bytes from 172.17.122.240: icmp_seq=2 ttl=64 time=0.592 ms
56 bytes from 172.17.122.240: icmp_seq=3 ttl=64 time=0.590 ms
56 bytes from 172.17.122.240: icmp_seq=4 ttl=64 time=0.638 ms
#防火墙version信息
[YQLT-H3C-F1000]disp version
H3C Comware Software, Version 7.1.064, Release 8601P14
Copyright (c) 2004-2020 New H3C Technologies Co., Ltd. All rights reserved.
H3C SecPath F1000-AI-60 uptime is 67 weeks, 3 days, 7 hours, 44 minutes
Last reboot reason: User reboot
Boot image: flash:/F1090FW-CMW710-BOOT-R8601P14.bin
Boot image version: 7.1.064, Release 8601P14
Compiled Apr 03 2020 15:00:00
System image: flash:/F1090FW-CMW710-SYSTEM-R8601P14.bin
System image version: 7.1.064, Release 8601P14
Compiled Apr 03 2020 15:00:00
SLOT 1
CPU type: Multi-core CPU
DDR4 SDRAM Memory: 8192M bytes
FLASH: 7296M bytes
CPLD_A Version: 1.0
CPLD_B Version: 2.0
Release Version:SecPath F1000-AI-60-8601P14
Basic BootWare Version:1.07
Extend BootWare Version:1.07
BuckleBoard Version:Ver.A
BackBoard1 Version:Ver.A
BackBoard2 Version:Ver.D
HD_BackBoard Version:Ver.A
Pcb Version:Ver.B
[SUBCARD 0] NSQ1F1MSPUOTXA(Hardware)Ver.B, (Driver)1.0, (Cpld)1.0
Boot Type: Cold
有文档说是还需要在nat接口下加入logging关键字,比如接口下packet-filter 3006 outbound logging,但是我这个版本没有
- 2026-08-14提问
- 举报
-
(0)
最佳答案

F1000‑AI‑60 Release8601P14 customlog 无 514 报文故障分析
现象:防火墙 ping 日志服务器 172.17.122.240 通;rsyslog UDP/TCP514 监听正常;抓包看不到防火墙发出任何 customlog 报文。
注意:customlog是用户自定义业务日志(nat / 会话 / IPS / 防病毒),和普通info‑center syslog是两套完全独立模块。ping 通只代表 ICMP 可达,不代表 customlog 业务报文可以正常发出。
你看到文档提到接口下packet‑filter … logging,那是普通 info‑center 报文日志,和 customlog 无关,你的版本确实没有这条命令,不用纠结。
1、先核对你的关键配置缺陷
plaintext
customlog host 172.17.122.240 export telecom‑userlog
customlog host source M‑GigabitEthernet1/0/0
① customlog host 缺少协议 / 端口参数(8601P14 版本高频坑)
该版本customlog host默认UDP 514;但必须显式确认协议。
你现在没有指定 protocol,部分版本会不初始化 socket,直接不发包。
修正完整 host 配置:
plaintext
customlog host 172.17.122.240 protocol udp port 514 export telecom‑userlog
customlog host source M‑GigabitEthernet1/0/0
② customlog format 只是定义模板,没有绑定到 host!!【核心问题】
plaintext
customlog format nat telecom
customlog format session
customlog format security‑policy sgcc
customlog format dpi ips sgcc policy‑hit
customlog format dpi anti‑virus
customlog format scd
customlog host 172.17.122.240 export telecom‑userlog
customlog format xxx只是创建命名模板;
export telecom‑userlog:telecom‑userlog 这个日志输出组,你没有把上面各个 format 添加进这个输出组!
现在 host 绑定的输出组telecom‑userlog是空的,没有任何日志条目,所以一条报文都不会发出来。
正确配置示例:把各个 format 加入输出组 telecom‑userlog
plaintext
#先定义各个format
customlog format nat telecom
customlog format session
customlog format security‑policy sgcc
customlog format dpi ips sgcc policy‑hit
customlog format dpi anti‑virus
customlog format scd
#把格式添加到输出组telecom‑userlog
customlog output‑group telecom‑userlog
format nat telecom
format session
format security‑policy sgcc
format dpi ips sgcc policy‑hit
format dpi anti‑virus
format scd
quit
#host绑定输出组
customlog host 172.17.122.240 protocol udp port 514 export telecom‑userlog
customlog host source M‑GigabitEthernet1/0/0
你缺失了customlog output‑group,只创建 format,没有加入输出组,host 导出的是空集合,无报文输出。
③ 安全域确认
customlog host source 指定源接口 M‑GigabitEthernet1/0/0,接口属于 Management 域;
防火墙本地产生的 customlog 报文属于 Local 域流量。
你策略:
plaintext
rule 61 name Management‑local
source‑zone Local
destination‑zone Management
action pass
方向是 Local→Management,允许设备本机访问 Management 域 IP,策略方向是正确的,这部分没问题。
2、验证查看命令(必须执行)
shell
#查看customlog全局状态
display customlog status
#查看输出组,确认output‑group里面挂载了format
display customlog output‑group
#查看host配置,确认export绑定输出组,协议端口
display customlog host
#查看统计,看是否生成报文、是否发送失败
display customlog statistics
重点看 statistics:
Generated:产生多少条日志;
Sent:成功发送;
Drop:丢弃计数。
如果 Generated=0:业务没有触发日志;
Generated>0,Sent=0 Drop>0:生成了但是发送失败(网络 / 套接字问题)。
3、业务侧日志触发条件
nat 日志你已经开启:
plaintext
nat log enable
nat log flow‑active 30
nat log flow‑begin
nat log flow‑end
必须要有真实 NAT 会话建立 / 拆除,才会产生 nat customlog;单纯 ping 不会触发 nat 流日志。
需要业务流量跑 NAT,产生新建 / 老化会话,才会输出日志。
4、debug 调试复现
shell
debugging customlog event
debugging customlog packet
terminal debugging
terminal monitor
业务跑 NAT 流量,观察调试输出,看是否生成日志、是否尝试发送。
5、补充区分两套日志,不要混淆
info‑center loghost:系统日志、设备事件日志;
customlog:业务日志(NAT 流、会话、IPS、病毒、策略命中),独立模块,必须 output‑group 把 format 挂载进去,host 导出 output‑group,否则零输出。
最简修复配置片段(直接复制)
plaintext
customlog format nat telecom
customlog format session
customlog format security‑policy sgcc
customlog format dpi ips sgcc policy‑hit
customlog format dpi anti‑virus
customlog format scd
customlog output‑group telecom‑userlog
format nat telecom
format session
format security‑policy sgcc
format dpi ips sgcc policy‑hit
format dpi anti‑virus
format scd
customlog host 172.17.122.240 protocol udp port 514 export telecom‑userlog
customlog host source M‑GigabitEthernet1/0/0
简短总结
根本原因:只创建 customlog format 模板,没有把 format 加入 output‑group 输出组,host 导出一个空输出组,不会发出任何报文;
host 配置显式补充protocol udp port 514,规避 8601P14 版本默认协议初始化异常;
配置完成后看display customlog statistics,观察 Generated/Sent/Drop 计数器;
需要真实 NAT 业务会话触发,ping 不会产生 nat 流日志;
local→management 安全策略当前配置没问题。
配置修改完成后,跑业务流量,再在 centos7 服务器tcpdump -i any port 514抓包验证。
如果要测试 TCP514,把 host 改为protocol tcp port 514。
- 2026-08-16回答
- 评论(1)
- 举报
-
(0)
感谢老大的讲解!可能是我的版本问题,我这里customlog 后面没有output-group , customlog host 后面没有protocol ,敲了port 514,默认不显示,默认514,debug诊断我来试试
防火墙抓包看看有没有发送出去
先确认下是防火墙问题还是其他问题
- 2026-08-14回答
- 评论(1)
- 举报
-
(0)
肯定了是防火墙的问题,不知道是哪里配置错误或者是不全,从debug抓包都可以看出来
肯定了是防火墙的问题,不知道是哪里配置错误或者是不全,从debug抓包都可以看出来

1. 确认日志输出配置正确性
查看信息中心配置
display info-center
display info-center loghost
关键检查项:
全局信息中心是否开启(默认开启,若关了需info-center enable)
日志主机地址、端口(默认UDP514,若用TCP需指定transport tcp)、VPN实例(若日志服务器在非公网VPN需绑定vpn-instance)是否匹配
输出规则是否允许对应模块/级别日志(如info-center source default loghost level informational)
2. 检查防火墙到日志服务器的连通性
用防火墙出接口ping日志服务器,注意绑定对应VPN
ping -a <出接口IP> <日志服务器IP>
若用TCP日志,测试TCP连通
telnet <日志服务器IP> 514
排查是否有路由、安全策略、NAT限制导致流量不通。
3. 确认有日志生成且输出到日志主机通道
查看本地日志缓冲区是否有日志生成
display logbuffer
查看日志主机通道统计
display info-center statistics loghost
若通道统计中发送数为0,大概率是输出规则或通道配置问题。
4. 抓包验证(防火墙侧)
在内网出接口抓包,替换interface和host参数
packet-filter interface <出接口名> inbound outbound
packet-capture interface <出接口名> capture-filter "host <日志服务器IP> and port 514" write flash:log.pcap
若抓不到包,回到配置/路由/策略排查;若抓到但服务器收不到,排查中间链路。
5. 常见坑点排查
防火墙日志(如会话日志、攻击防范日志)需单独配置输出到日志主机,不是默认随系统日志输出
若用TCP日志,需两端都配置TCP模式,且防火墙侧info-center loghost
日志服务器rsyslog需开启对应模块(UDP/TCP接收模块,$ModLoad imudp/$ModLoad imtcp),且配置了接收规则
- 2026-08-14回答
- 评论(2)
- 举报
-
(0)
disp logbuffer也有很多日志输出

按你的方法,info-center source default loghost level informational默认是开启,执行了一遍,我debug了相关报文,源是本机接口IP,目的是日志服务器IP,回包也抓了,debug没有抓到任何报文,但是我主动发起telnet 514端口到日志服务器,debug立刻有显示报文发送,并且日志服务器也有回包,也就是防火墙根本就没发送报文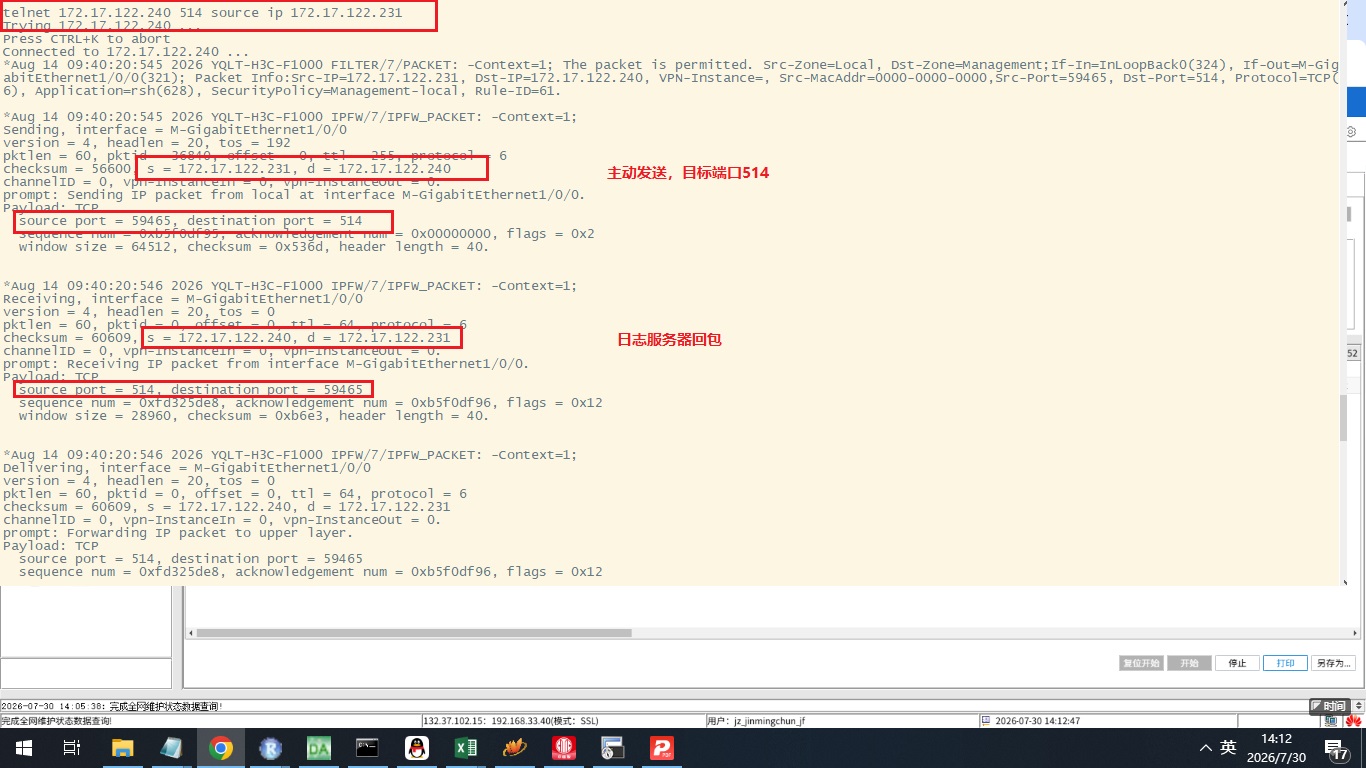
- 2026-08-14回答
- 评论(0)
- 举报
-
(0)
编辑答案


亲~登录后才可以操作哦!
确定你的邮箱还未认证,请认证邮箱或绑定手机后进行当前操作
举报
×
侵犯我的权益
×
侵犯了我企业的权益
×
- 1. 您举报的内容是什么?(请在邮件中列出您举报的内容和链接地址)
- 2. 您是谁?(身份证明材料,可以是身份证或护照等证件)
- 3. 是哪家企业?(营业执照,单位登记证明等证件)
- 4. 您与该企业的关系是?(您是企业法人或被授权人,需提供企业委托授权书)
抄袭了我的内容
×
原文链接或出处
诽谤我
×
- 1. 您举报的内容以及侵犯了您什么权益?(请在邮件中列出您举报的内容、链接地址,并给出简短的说明)
- 2. 您是谁?(身份证明材料,可以是身份证或护照等证件)
对根叔社区有害的内容
×
不规范转载
×
举报说明
感谢老大的讲解!可能是我的版本问题,我这里customlog 后面没有output-group , customlog host 后面没有protocol ,敲了port 514,默认不显示,默认514,debug诊断我来试试