
在处理Netstream问题时,经常遇到服务器侧(如NTA)无法查看到数据的问题,或是无法解析,此时需要确认NetStream是否已经发送了正确的数据。
Netstream上可以通过命令查看发送统计及缓存数据,除此之外可以抓取Netstream管理口报文,来确认是否发送正常。
1.首先在命令行下查看统计:
IP export information:
Stream source interface :
Stream destination VPN-instance :
Stream destination IP (UDP) : 172.31.0.232 (3000)
Version 5 exported stream number : 0
Version 5 exported UDP datagram number (failed): 0 (0)
Version 9 exported stream number : 1679
Version 9 exported UDP datagram number (failed): 1679 (0)
MPLS export information:
Stream source interface :
Stream destination VPN-instance :
Stream destination IP (UDP) : 172.31.0.232 (3000)
Version 9 exported stream number : 0
Version 9 exported UDP datagram number (failed): 0 (0)
IP netstream cache information:
Stream active timeout (in minutes) : 30
Stream inactive timeout (in seconds): 30
Stream max entry number : 2500000
IP active stream entry number : 3
MPLS active stream entry number : 0
L2 active stream entry number : 0
IPL2 active stream entry number : 0
IP stream entry been counted : 1679
MPLS stream entry been counted : 0
L2 stream entry been counted : 0
IPL2 stream entry been counted : 0
Last statistics reset time : 04/26/2000, 12:30:57
IP packet size distribution (2227344 total packets):
1-32 64 96 128 160 192 224 256 288 320 352 384 416 448 480
.000 .999 .000 .000 .000 .000 .000 .000 .000 .000 .000 .000 .000 .000 .000
512 544 576 1024 1536 2048 2560 3072 3584 4096 4608 >4608
.000 .000 .000 .000 .000 .000 .000 .000 .000 .000 .000 .000
Protocol Total Packets Stream Packets Active(sec) Idle(sec)
Streams /Sec /Sec /stream /stream /stream
---------------------------------------------------------------------------
IP-other 560 1 0 3431 1800 0
ICMP 3 0 0 6 10 30
OSPF 1116 0 0 271 1800 0
Type DstIP(Port) SrcIP(Port) Pro ToS If(Direct) Pkts
DstMAC(VLAN) SrcMAC(VLAN)
TopLblType(IP/MASK) Lbl-Exp-S-List
---------------------------------------------------------------------------
IP 224.0.0.5(0) 192.168.12.253(0) 89 192 XGE0/0(I) 88
IP 224.0.0.18(0) 192.168.12.253(0) 112 192 XGE0/0(I) 2740
IP 224.0.0.5(0) 192.168.13.249(0) 89 192 XGE0/0(I) 44
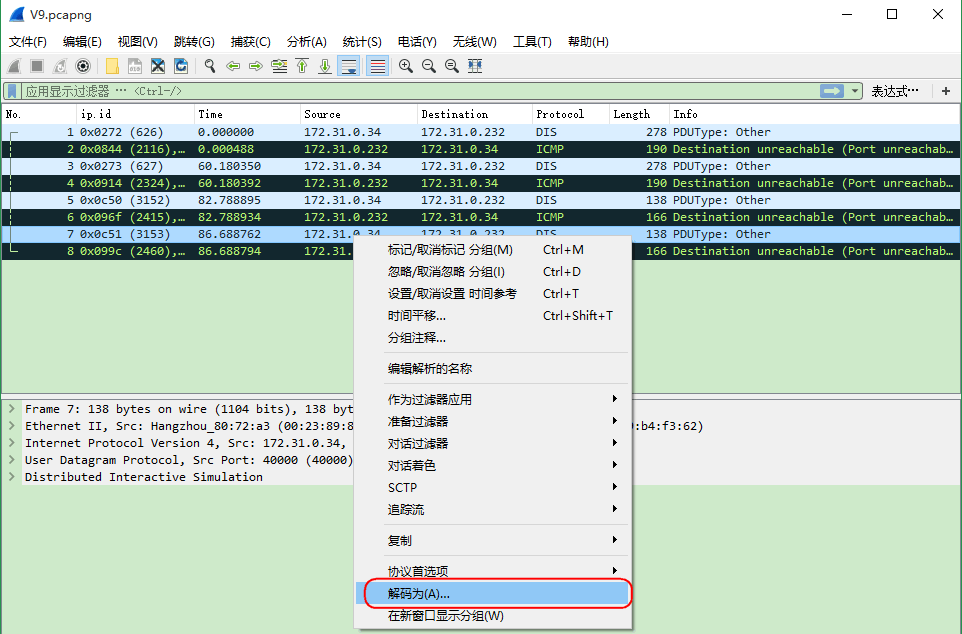
2.将PC连在NetStream管理口进行抓包,然后用wireshark解析。
a.鼠标右键报文,点击“解码为”
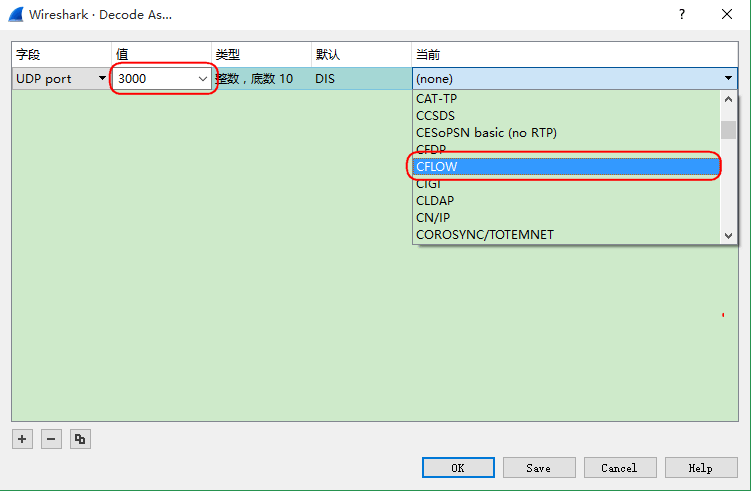
b.在弹出的页面中,UDP port的“值”选择Netstream上配置的发送端口,“当前”选择CFLOW,如下所示,然后点击“OK”
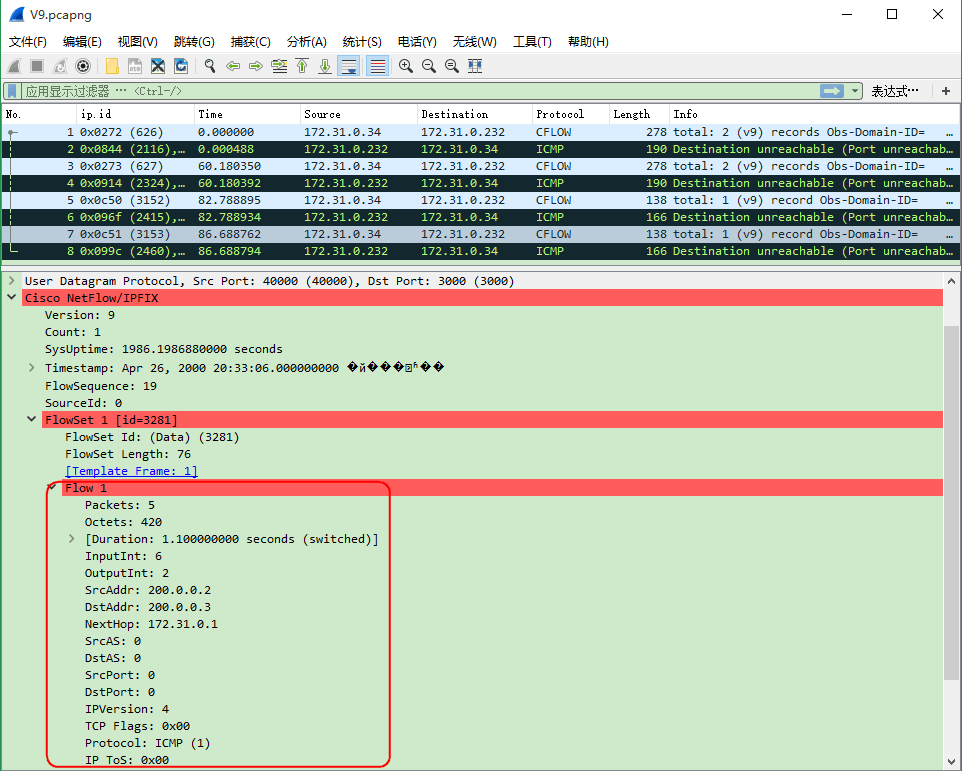
c.此时就可以将报文解析
该案例暂时没有网友评论
编辑评论
✖
案例意见反馈


亲~登录后才可以操作哦!
确定你的邮箱还未认证,请认证邮箱或绑定手机后进行当前操作